Showing posts with label mapping. Show all posts

Thursday, June 23, 2011

June 21: Hump Day

Helen Brandt plots map points using the Total Station

Another rainy day kept us from returning to excavations until the very end of the day.  Most students continued making dog leash collections and Helen Brandt and Andrew Border were the mapping team.
Andrew Border holds the prism for mapping

A Dog Leash Collection

 Most excavation units were hopelessly wet--some teams dipped water out of their units by hand to make the unit look less like a square swimming pool.  Near the end of the day, crews started to excavate once again, but the threat of another storm encouraged us to pack up and leave for the day. Students returned to the lab to work on their posters for Archaeology Day in Cherokee next week.
Despite the weather challenges, we made great progress in the research of this site.

Sunday, June 19, 2011

June 18: A mapping weekend


The Nolichucky River

The 9AM-5PM corporate grind goes not exist here in Tennessee. No, the work must continue....Saturday a few of us went back to the site to water-screen and continued to surveying the site.

We are using a Total Station to map the site. The Total Station is a sophisticated survey equipment used to precisely plot points for the map. This equipment is nice because it calculates distance relative to the datum, placing the point within  the horizontal-vertical axis. Yes, there is more to archaeology than digging! 


The purpose of archaeological survey is to understand the spatial pattern of the site by making a map of the topography and artifact distributions. This mapping creates a record of the relationship between cultural features and significant environmental factors. It is important to accurately relate archaeological sites to natural or cultural landmarks in order to accurately record changes in the topography.  

We toiled for a few hours only to retreat back to our cabins fleeing from an approaching storm.  Farewell my comrades in archaeology! 

- Andrew


Tuesday, June 7, 2011

June 6: Monday, Monday

Our return to work this week involved finishing plotting the site grid and refining the definition of the site. We had a minor equipment failure when the battery ran out for the total station. While the battery charged, the crew worked on better defining the south and east ends of the main settlement area. Crew members also delineated the outlying settlements in greater detail. The unusually high temperatures continued, but that did not deter the crew. We did, however, enjoy being in the cool recesses of the lab. Each student worked on establishing the topic for their Archaeology Day poster exhibit at the end of June at the Fairgrounds in Cherokee, North Carolina. Students also continued to classify the unanalyzed ceramics from previous fieldwork in the region.

Saturday, June 4, 2011

June 2: Grids are Good

The activities today were done with an eye toward next week and the beginning of excavation. Students continued to refine our understanding of the site patterning. Groups working in separate areas worked towards each other, eventually meeting and joining together zones of intensive survey. Even though it was hot, enthusiasm was high as we began to see clear paths or lanes and continued to make exciting finds.


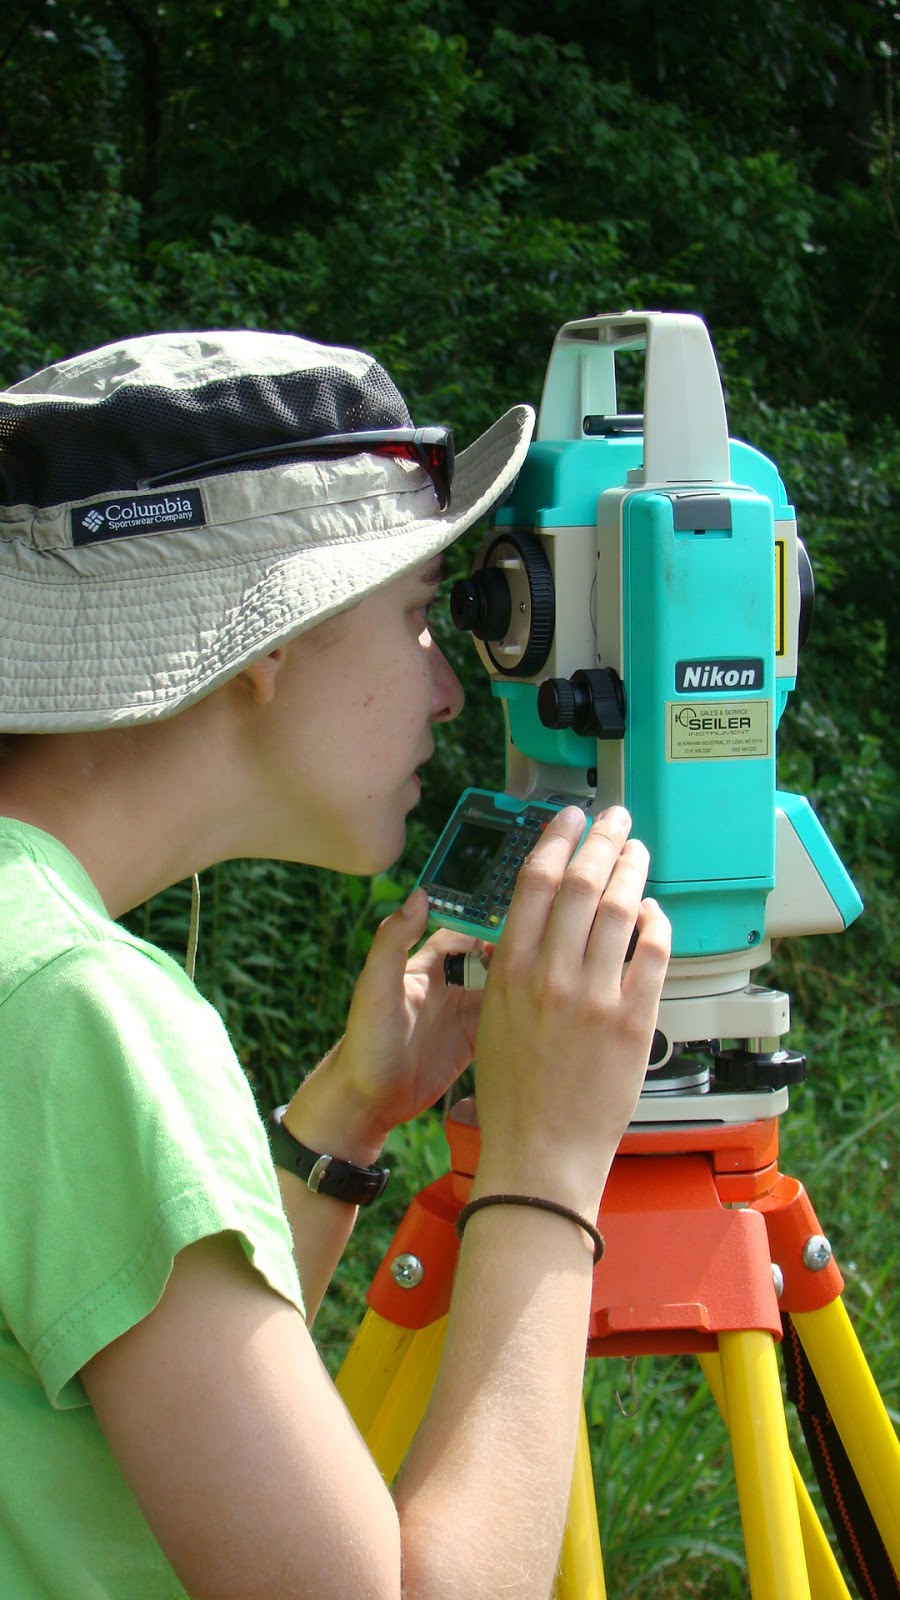
Students also learned about mapping with a Total Station, an electronic surveying device. A few students had a turn holding the rod for measurements to be taken. The Total Station is a great tool for laying out a grid over the entire site. The grid will help us keep track of the provenience of surface collections and map the site in detail. Steve Scheflow earned the “intrepid archaeologist” award for helping lay out the site grid across the backswamp.


Steve Scheflow planting a flag


In the lab, students tried their hand at drawing artifacts. They used charts to figure out the diameter of vessels and experimented with ways to determine how to orient rim sherds. The orientation of rims can give us a good idea of the shape of the vessel, and the rim diameter gives us an idea of the vessel size.


Cailin Meyer is prepared

Friday, June 4, 2010

Day 4 - Mapping


After two days of regional survey, we narrowed our activities to the site which will be the focus of the rest of the field school. By no means are we alone at the site. The immediate environs are home to dozens of cattle who insist on licking (for salt) and other wise crowding around the project van.


Today the students learned several elements and steps in creating a site map. These methods are illustrated in the video below

- Contour walking. Utilizing a GPS, the students followed the contours of a nearby hill, to experience and understand elevations on topographic maps.

- Collecting topographic data. All of the students took measurements from various points in and around the site, using a traditional surveyor's transit. Utilizing such equipment and collecting and transforming the data by hand, rather than with a computerized total station, teaches the methodological principles behind mapping. As the season progresses, students will also utilize the computerized total station.


- Mapping topographic data. After a good day in the hot sun, the students returned to the lab, and created a topographic map using the data they collected earlier.